
In this article we are going to learn how to use semi-automated tools on webpages, using a range of freely available tools. We’re primarily going to use Google Chrome for installing any extensions, but where extensions are available on other browsers, we will of course provide links to those extensions and state if they’re unavailable on a particular browser. It’s also worth noting that where we refer to Google Chrome, the installation process is the same for Microsoft Edge and the Brave browser, as these use the same underlying technologies as Chrome, called Chromium. Firefox and Safari have their own underlying technologies.
Aside: It’s also recommended to follow long on a laptop or desktop (MacOS, Windows or Linux) as installing extensions isn’t always possible on tablets and phones.
What is Semi-automated testing?
Where digital accessibility is concerned, semi-automated testing is the use of third-party tools to check for any detectable accessibility issues on webpages (usually 1 page at a time, hence why it is semi-automated). These tools can provide a vital first line of defence against many common accessibility issues, such as:
- Invalid HTML code
- Images with missing alt text
- Colour contrast issues
- Controls such as buttons or links, without an accessible name
- Misuse of or missing ARIA (Accessible Rich Internet Applications, the attributes that help assistive technologies understand parts of a webpage, where the HTML alone does not provide sufficient meaning)
- Focus order, which ensures that users using keyboards to consume and navigate web content reach the content in a logical order, that matches the source code
- A good heading hierarchy and page structure, using landmarks which help users of assistive technologies easily find interesting bits of content
The list above is by no means exhaustive, but they are some of the most common issues detected. It’s also worth noting that these tools are not perfect, no tool can completely test a page, in fact, automated or semi-automated tools typically only pick up around 40% of known accessibility issues, but they are a invaluable tools and it’s great practice to familiarise yourself with them and check your pages or sites to get a basic overview of the accessibility.
Tell me about the tools
Every accessibility professional will have a toolkit, usually a folder full of bookmarks, several browser extensions and some bookmarklets that test specific things, these will naturally differ between individuals, so this list is again not exhaustive.
There's a couple of considerations to be aware of before we delve into the tools:
- Some of these tools reside in the "DevTools", when we reference "DevTools", we're referring to the browsers' code inspectors, where we can view all of the HTML, CSS and much more for the current page. To access the DevTools, you can right-click anywhere on the page and selecting Inspect or Inspect Element, alternatively, you can just press the F12 key and it will open up (depending on your keyboard, you may need to press the function or fn key, along with F12).
- It’s also worth noting that Semi-automated tools won’t test content that is hidden in the DOM, as an example, if you had a page with a modal, you’d need to test the page with the modal closed and then again with it open and this applies to all disclosure type widgets. We often run tools on a page that has interactive widgets and it can at times look quite positive, not too many errors, nothing difficult to resolve for the developers. When we click a button to show a date picker, modal, accordion, navigation etc, this interactive content is exposed to both the DOM and the accessibility tree, the previously hidden elements often expose a litany of accessibility issues.
Axe is available on Chrome, Firefox and Edge; sadly it’s unavailable on Safari. Axe is a free browser extension that can run a series of tests on a single page at a time.
How to use Axe
Visit the Axe browser extension page, where there are links for each of the previously mentioned browsers. Simply visit that page in the browser you want to use Axe with and click the Install free [your browser] extension, which will then navigate to the extensions store for that particular browser, once there, click the add to [your browser] button and follow any on-screen prompts.
Axe resides in your DevTools, so once you have those open, we will need to click on the correct tab, within the DevTools (the position of this will be different than the following image, as I have moved it to to the left, so it is always easy to find for me.
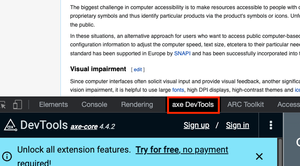
Once we open the Axe tab, we are presented with the Axe interface in which there are 2 primary panels. There is the Let’s get started panel and the Start an Intelligent Guided Test panel. We don’t need to worry about the latter, that’s the paid version, which teaches you how to manually test those elements that tools alone cannot test.
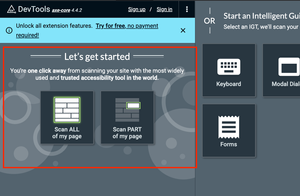
Within the Let’s get started panel, the option we need to concern ourselves with is the Scan ALL my page button. This does exactly what it indicates it will do and it performs an analysis on the current page.
I ran this test against Wikipedia, as I needed to demonstrate on a website and we won't find any issues on this one, Wikipedia is public enough and well known enough to be a suitable example. Disclaimer, we are not here to test Wikipedia, we’re just demonstrating using the tools.
Interpreting the test results
So, we have several panels of interest, after we click the Scan ALL my page button, it may be necessary to either drag the DevTools up to be able to see those panels or alternatively you can detach the DevTools from the browser window, by clicking the 3 vertical dots (Customise and control DevTools button) and then in the Dock side options select undock into a separate window (visually represented by 2 rectangles 1 overlaying the other), choose whichever option works best for you.
- The first panel we encounter is the Total issues panel, within this panel it will inform us how many actual issues and/or potential issues it has detected, as well as the severity of those issues
- The second panel we encounter is the All issues panel, which is essentially a summary of issue type
- The final panel is the Issue Description panel, which provides details about each detected issue
The free version does not allow us to test against a specific level of WCAG, for instance, many people will be most interested in meeting the AA standard (which is the minimum legal requirement in many countries or sectors), which means satisfying both level A and level AA requirements, the free version tests against A, AA and even AAA. So, in reality, some of the errors we get may not be actual failures against the level we’re aiming for, but it's important to note that legal conformance does not necessarily mean accessible, WCAG compliance is the floor, not the ceiling, so aim high, your users deserve it.
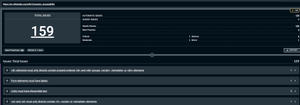
In the All Issues panel, our issues are grouped by issue type and adjacent to the issue type is the number of issues for that particular issue type. As an example, the panel says Links must have discernible text 2 which means 2 link elements on that page have no accessible name.
If we click that issue, the content of the Issue description panel changes to reflect that particular issue, it’s important to note it is only showing the first issue of that type, don’t worry though, we can cycle through any further issues of the same type.
Finding the issue
At the top of the Issue description panel, there are some handy tools that help to quickly locate the issue, both on the page or in the source code:
- Highlight: clicking this will scroll the element into view and add a highlight and a tooltip to the element in question
- Inspect: This will open the Elements panel in your DevTools and highlight the particular HTML element that is causing the issue. By viewing the code on our example page, I can see that there is a link that has no hidden or visible text and it surrounds an image with an empty alt attribute. So now I know to report this as an accessibility failure, because links must have an accessible name
Just below those 2 options, there are some details about the issue, the impact in this case is serious and also we have Issue Tags, these inform us that it is an actual failure and it fails both WCAG 2.4.4 Link Text (In Context) and 4.1.2 Name, Role, Value, both of those are level A requirements.
To find the next issue of that type, at the top of the Issue description panel, there are Next issue and Last issue buttons, these are visually represented as a chevron and double chevron, respectively.
Further down in the panel, there are some options which will help you to resolve the issue, in this case it’s as simple as adding some text, that will inform users of the purpose of that link, I would suggest alt text here, as these are functional images.
Automated and semi-automated tools are perfectly imperfect, they can’t second guess developer intent in all circumstances, so oftentimes, the issue will be categorised under Needs review. Some common issues that often need review are complex widgets, missing roles and colour contrast. Colour contrast often needs review when backgrounds or font colours use gradients or opacity that is lower than 1 as the algorithm cannot correctly calculate the contrast, so it requires human review.
Axe provides a useful set of tests to enable you to identify issues on webpages. Always remember to test the page as it first displays, then locate any accordions, modals, tabbed interfaces, disclosure menus or indeed anything else that changes the presentation and/ or functionality of the page and test with each open and it’s likely you will discover additional issues.
Wave is available for Chrome, Firefox and Edge and again, not Safari. Visit the WAVE page and locate the link for your chosen browser’s extension store and follow any prompts to install it.
The WAVE extension works a little differently, in that it doesn’t require you to use the DevTools, it has a handy button in your extensions bar (usually at the top of your browser). The button’s name is WAVE and it is visually represented as a grey circle with a white letter “W” inside. Alternatively, right clicking anywhere on the page will display a context menu, selecting Wave this page will also run the WAVE tool.

The only thing we need to do here, is click the button and the WAVE interface opens up.
Interpreting the test results
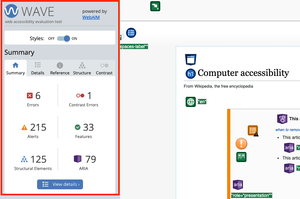
The WAVE interface usually appears on the left of the screen, although this may change dependant on viewport size, resolution or zoom settings.
There is A Summary section, which displays a tabbed interface, each tab, with the exception of the Summary tab provides additional information about the page as a whole:
The Details tab lists all of the page information detected, it’s important to note that these are not all errors, some will be checking the page’s structure and some will be Alerts which are those checks that require manual review.
Each section in the Details tab has a More information button (visually represented by a white lowercase “i” in a grey circle. When clicked, each will open the References tab, with generic details about that check.
Each icon within a section is actually a button, when clicked it will scroll the item into view and add a dotted line around it. To view the code for that particular element, at the bottom of the page, there is a Code button, visually it is represented as white text </> Code, with a green background. This opens a source code viewer and by clicking any of the icon buttons in the details tab, it will highlight that specific piece of code.
By using the More information button, to get the Reference details and the source code viewer, we can determine what is wrong with the code in question, alternatively, WAVE actually adds these icons over the page, so you can click each individual icon to highlight that code in the source code panel.
The Structure tab displays the structural content of the page such as heading hierarchy and landmarks. This enables us to check, at a glance that:
- The expected landmarks are present, most sites should have a
<header>(orrole=”banner”), a<nav>(orrole=”navigation”), a<main>(orrole=”main”) and a<footer>(orrole=”contentinfo”). There are of course other roles that assist users in quickly navigating to areas of interest - Additionally, it is also possible to check the heading hierarchy, it’s important to some users that headings are marked up using the correct
<h1>through to<h6>tags and that they’re in a logical order. A page should always have a<h1>, major sections would have<h2>s, subsections<h3>s and so forth.
Finally, there is the Contrast tab, which contains WebAIM’s Color Contrast Checker and allows for a foreground and background colour’s hex values to be input and it will calculate the contrast between those values. If there are any automatically detected errors, there will be a Very low contrast [issue number] image for each. This can be clicked with a mouse/finger, which will scroll the offending item into view, this element sadly isn’t keyboard focusable, so keyboard users would need to tab into the main page and locate it manually, which may be quite difficult on larger pages, with lots of issues.
Arc is only available with Chrome, although it can be downloaded to other Chromium-based browsers, I added it to MS Edge using this process:
Please note: ARC is being a little buggy, right now, so this guide is incomplete.
- With Edge open, navigate to TPGi ARC Toolkit
- Locate and click the Download ARC Toolkit button (it does have a version number, but I have omitted that, in case it has an update. At the time of writing, it’s the main call to action on the page
- At the top of the page there is a prompt from Edge, which asks if you’re happy to Allow extensions from other stores, this is perfectly fine in this instance
- Click Allow within the dialog that opens
- Within the Extensions bar on Edge, click the Extensions button, which is visually represented by what looks like a puzzle piece
- In the list of options that pop out, click Manage extensions and ensure that the toggle switch Turn on ARC Toolkit is checked (visually this will turn blue and the toggle will move to the right)
- You need to restart Edge, at this point (don’t lose any important tabs though, we’ve all done it)
- Once Edge restarts, much like Axe, ARC lives in the DevTools, which can be accessed by right clicking anywhere on the page or pressing F12
For Chrome, access TPGi ARC Toolkit locate and click the Download ARC Toolkit button, then download the same way as we have the previous extensions. If there are any issues with it not displaying in the DevTools, it may be that it needs switching on, which is the same process from Step 5, in the Edge instructions, in the previous list.
I would recommend detaching the DevTools, using the Undock button, which can be accessed by clicking the Customise and Control DevTools button (visually represented by a vertical ellipsis).
There are 2 panes in The ARC interface, the Summary panel, which is typically on the left and the Information panel, which is typically on the right.
Run tests
In the Summary panel, there are 2 buttons of interest Run tests and More tools:
- Run tests will test the page against ARC’s rulesets to identify all the issues it can detect
- Other tools contains some useful tools for running some otherwise manual tests
Other tools
The 4 useful tools here are:
- Send URL to the W3C HTML Validator (which sends the whole page), naturally, well-formed HTML is a huge part of creating accessible interfaces, so we should be looking for invalid nesting, duplicate IDs, missing child tags, misuse of ARIA and invalid ARIA roles etc
- Send the page to the ARIA checker, this provides details on expected patterns when using ARIA, it will flag some patterns where the ARIA does not meet the specification
- Check Text Spacing (Necessary to meet WCAG 1.4.12 Text Spacing), all text on the page should visibly increase its size, Line Height, Letter Spacing, Word Spacing and Paragraph Spacing
- Check Page Reflow (Necessary to meet WCAG 1.4.10 Reflow), this will set the browser width to 1280px and set zoom to 400%, which replicates a 320px viewport width. At this viewport, there should be no loss of content or functionality and the page should not scroll in 2 directions (there are some exceptions that can scroll in 2 directions, such as maps, complex data tables, complex images etc, but not the whole page). Note: when I prepared this guide the Check page reflow was present, but at the time of publishing it appears to be unavailable, I'll leave this in for now, as it may be a temporary issue.
No installation is necessary for Lighthouse, it’s built right into Chromium-based browsers, Chrome, Edge, Brave etc. It can be accessed within the DevTools panel, by right-clicking anywhere on the page and selecting Inspect or by pressing F12.
Lighthouse will be one of the tabs at the top of the DevTools panel, clicking that will tab display the Lighthouse interface.
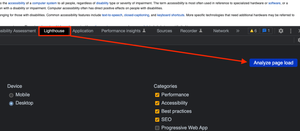
There are a number of options we can test against, including Best practices, SEO, Performance, Progressive Web Apps & Accessibility, I’m just going to focus on accessibility in this guide, but if I were developing a site, I would definitely test against Performance, SEO and Best Practices, as performance definitely does link to accessibility, as people with disabilities are a marginalised group and more likely to experience socio-economic related poverty, which means they may not be able to afford the latest and greatest tech, so a page that takes 15 seconds to become interactive on an iPhone 14 Pro Max over a 5G connection may be completely unusable for a user accessing on an old low-powered smart phone, using only 3G.
It is possible to run Lighthouse on a simulated 3G mobile, I would recommend testing on both Desktop and Mobile, as it is interesting to compare the difference in issues on various viewports. So click the Analyze page load button and wait for Lighthouse to Evaluate the page.
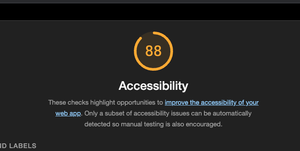
After the test has ran, a score will be given against each category, as this guide is only focusing on the Accessibility category, I see a score of 88 out of 100 on the Wikipedia page. Which to the uninitiated may seem fairly good, as a point of interest, Lighthouse actually uses Axe’s engine (Axe Core) to perform the tests, but it doesn’t use the latest version of Axe Core and in any instance, I can see it has missed quite a few issues that the other tools detected, as I have been testing the same page each time.
Below the score, there are accordion components, which when expanded will provide information on elements that fail the tests and issues to manually check. You can click the element identifier, which is situated next to the thumbnail image and it will open up the Elements panel and take you to that exact line of code.
Aside: I tend to find that having Axe installed conflicts with page performance scores on Lighthouse, so if you're going for hundreds across the board in Lighthouse, it may be useful to test in Incognito Mode, in another persona or disable other extensions).
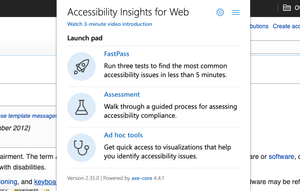
Accessibility Insights, by Microsoft is available on Chromium-based browsers, such as Chrome, Edge and Brave. Additionally, there are Android and Windows versions, which can be used to test non-web applications, although this guide will focus on the web version.
Navigate to the Accessibility Insights page and click the Get Accessibility Insights link and then click the Add to [your browser] link, which will take you to the web store, where you can then add the extension. Go through the prompts to allow access and then the extension should have an Accessibility Insights for web button in the extensions bar of your browser (visually represented by a white magnifying glass on a navy-blue background).

Clicking the Accessibility Insights button will give us 3 main options, within it's Launchpad panel:
- Fast pass, which runs 3 common tests, for Automated Checks, Tab Stops and Needs Review
- Assessment, which can guide you through both the manual and semi-automated testing processes
- Ad-hoc Tools, which offer 6 quick tools for Automated Checks, Colour Contrast, Heading structure, Landmarks, Tab Stops and Needs Review
The Assessment option explains each step and considerations for testing against WCAG manually and can provide invaluable information to detect many issues that cannot be detected without human review. Going through each of the checkpoints and marking Pass or Fail after testing each element will give an overall result and help to understand much of the testing process.
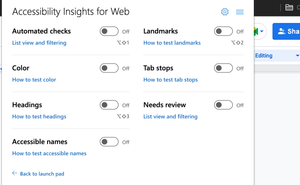
Ad-hoc Tools is super useful, as it overlays the webpage with outlines for structural elements, such as headings and landmarks, which makes it easier to understand the page’s composition and identify where improvements could be made. Additionally, it can help identify text that is styled to look like a heading but not marked up as such. Tab Stops is incredibly useful, as it tracks and enumerates focus throughout the page, when keyboard focus moves around in an unexpected order, that does not match the visual order, this becomes frustrating and confusing for users, as content is accessed out-of-sorts and does not meet their expectations. I tend to screenshot problem areas, for my reports, so the team tasked with remediation can also see the problem, in addition to the text I supply which explains the issue.
The Color option will desaturate the page, removing all colour, which helps to identify those elements that were relying on colour alone to communicate information, common occurrences may be the border of an input turning red if there's a validation error, with no supporting error text or icon, when colour is removed from the page, it no longer communicates anything and this is the experience some users face, when interfaces use colour alone as a means of communicating errors, successes and other important information.
The Fast Pass option, contains a selection of the tools explained above, it’s very useful, but for brevity, I won’t go into details, as those tools exist in the other options and have already been explained.
The Equal Access checker, resides in the DevTools after it has been installed and is available for Chromium-based browsers, as well as Firefox, Safari still gets no love from the vendors though. Please visit the IBM Accessibility Checker page, there are links to install from your browser vendor’s web store (remember, you can install Chrome extensions on Edge and Brave). Follow the usual process to install the plugin and then open up your DevTools by pressing F12 or right-clicking and choosing Inspect, in this instance, the tab you should locate, within the DevTools is named Accessibility Assessment.
There are 2 panels for the Equal Access checker, the first being the Scan panel, where you can scan the page and get an overview of the results and the second being the Summary panel, which will provide further details about a specific issue.
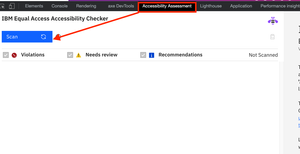
In the Scan panel, click the Scan button and wait a moment for the tests to complete. The Scan panel is now populated with issues and recommendations, each one against a WCAG success criteria and they are expandable accordions, which when opened will list each Issue, Recommendation and Needs Review item. These can be clicked and the Summary pane will provide you with further details on why it is an issue and tips on resolving it. It also shows the element location, but there is no nifty button that will scroll it into view or open the Elements panel and highlight the code for you.
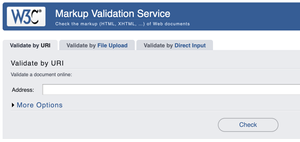
Finally, the HTML validator, perhaps the most important tool in any Developer’s or Accessibility Practitioner’s toolkit. Many accessibility issues are related to poorly formed HTML, such as missing required child tags, duplicate IDs, incorrect nesting, lack of semantics or ARIA alternatives and much more. If a page is well structured, uses the correct tag for the job and uses HTML to the spec, this goes a very long way towards creating accessible interfaces, sure we can introduce new issues with CSS, JavaScript or even ARIA, but if we get that foundation right and then add the other technologies to enhance the page, whilst considering the effects of our design, development or content choices on all users, we can open up our web apps to a wider range of people.
- I tend to use ARC toolkit to send a page to the Validator
- The Web Developer extension for Chrome can also send the DOM to the validator
Or, if you access the Validator itself, there are options to Validate by URI, Validate by File upload or Validate by Direct Input (paste the page source into the validator, if you choose this approach, it may be easier to right click, select View page source and then copy the entire contents of your newly opened browser tab and paste into the validator's Direct input input).
There are some errors that don’t affect accessibility, but for any developer interested in accessibility, standards, performance or SEO, the aim should always be no errors detected.
There are an abundance of tools out there, for testing webpages, these are just some of the semi-automated ones, there are lots more to discuss too. I personally do not use all of these tools on a single site, the reason for this is:
Most of them use Axe Core anyway, but the actual Axe extension gets the updates much quicker, so I personally use the following:
- Axe as my primary Accessibility checker
- Accessibility Insights to check landmarks, heading structure and tab stops
- ARC Toolkit to check Text Spacing, page Reflow and send the DOM to the HTML Validator
I use other tools, but mostly web-based or bookmarklets, which I’ll outline in another guide. Different practitioners will prefer a different selection of tools, I use the automated tools quite late in my testing process, as I like to use the DevTools to inspect the code and perform manual tests, I then run Axe at the end, to check whether I found everything it can detect, but this is something that helps me to make testing a little personal challenge, it’s not quite Garry Kasparov vs a supercomputer, but I like that little bit of satisfaction I get if I find everything Axe does before I run it, obviously it beats me from time to time, and detects something I missed, which helps me to improve for next time.
So, semi-automated tools are very useful, no 2 work the same and no 2 yield the same issues, there are often some deviations in their results. But, always remember, that these tools can’t catch everything, a lot depends on manual testing and even more depends on testing with users that have disabilities (assuming you offer them remuneration for their time, of course).